Everything you need to help you make better business decisions
Trakdesk provides you with the most powerful reporting suite ever! With more than ten different reports and a variety of powerful filters and options, it provides you with all the insight that you need to take your customer support to the next level. It also allows you to filter the data however you want and dig deeper into your helpdesk performance.
These reports allow you to analyze your helpdesk performance from different aspects. In short, this provides you with all the metrics you need to make critical business decisions to improve your customer support service.
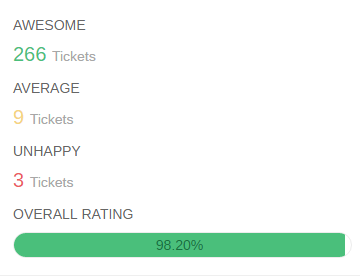
Trakdesk has built a powerful, configurable customer satisfaction survey tool right into your helpdesk, which is very useful to measure your customers happiness. It automatically inserts satisfaction surveys right into tickets which allow your customer to give their feedback on the quality of service they have received from your support agents. You can then analyze your customers feedbacks so that you can make better business decisions.
Customer satisfaction means a lot to your business and should be your number one priority. Trakdesk provides deep data-driven analytics that shows your overall customer satisfaction rate and ratings for each of your support agents. You can also filter the data with advanced filters to get more in-depth metrics.
The Helpdesk overview report in trakdesk gives you a full analysis of you helpdesk performance in a single view. It also enables you to compare key ticket metrics in your helpdesk so you can analyze your helpdesk performance from different dimensions.
The Helpdesk overview report consists of thirteen (13) different key ticket metrics. You can completely interact with each metric and its categories by clicking on any option in each category. Understanding the Helpdesk Load Report.
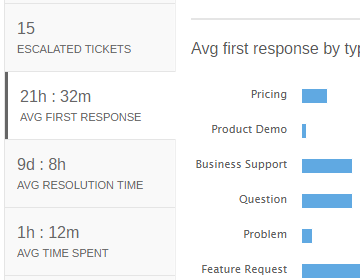
With agents summary report, you can compare your agent's average response time, average resolution time, average time spent on a ticket, hours worked and number of tickets worked on.
Compare groups to see which group is performing the best. You can compare things like; group average response time, average resolution time, average time spent on a ticket and number of tickets resolved.
Ticket satisfaction Survey report generates detailed insights of what your customers really think of the service you are providing to them. This report will help you to build better customer relationships.
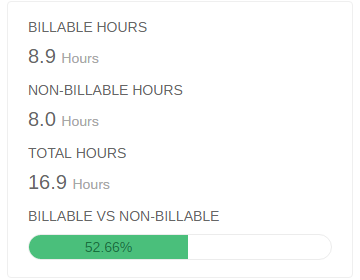
With Time Entry Reports, you can get insights as to which agent is clocking the most hours and the type of billing being used. You can also generate invoices for the hours worked and bill your customers directly from your helpdesk.
No need to whip out the calculator or even generate pages of reports just to see how your helpdesk is performing. With Helpdesk Overview, we have built intelligent formulas that will explain all about your helpdesk performance in a nutshell.
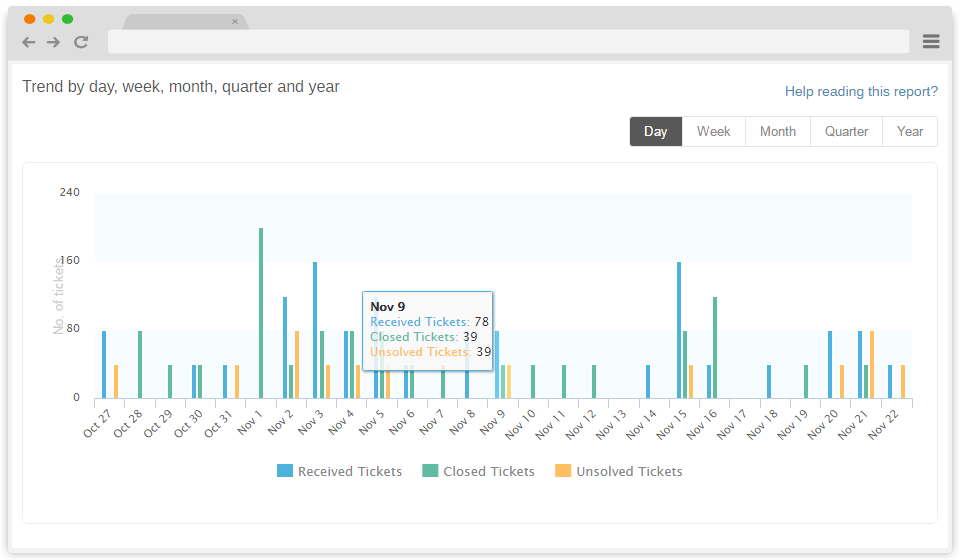
Get detailed insights and analyze the load on your helpdesk as well as performance of your agents. This report also provides you with timely breakdown of ticket arrival, along with new, closed and backlog tickets.
As a company, you will always want to know if your services are up to standards. With Service Level Agreement (SLA), you can get detailed insights as to what is affecting your standards of service so you can quickly make the necessary adjustments.
Providing support to multiple companies can be chaotic, especially when generating reports at the end of your fiscal year. With Trakdesk, you can generate detailed company based reports in minutes.
Managing tons of departments is like finding a needle in a haystack. Impossible! But no need to worry, with ticket by department report, you can easily generate statistics for each department in seconds.
Your helpdesk is like your second office in the cloud, why not protect it? With security reports, you can get insights as to who is logging into your helpdesk, from what device, type of browser and many more.
Financial report is very important for any business. You can easily analyze billing transactions and understand more about your business finances. Whether you are making a profit or cutting even.
Invoice reports make it easy to balance off your balance sheet at the end of the year. It provides in-depth statistics about the total amount you have earned, taxes and discounts provided to customers.